Stop guessing: event analytics are here on Attndly
Every event on Attndly now comes with built-in analytics. You can see how many people visit your event page, which platform sent them, and where they drop off before buying a ticket. No setup, no extra tools.


Every event on Attndly now comes with built-in analytics. You can see how many people visit your event page, which platform sent them, and where they drop off before buying a ticket. No setup, no extra tools.
Your event page traffic at a glance
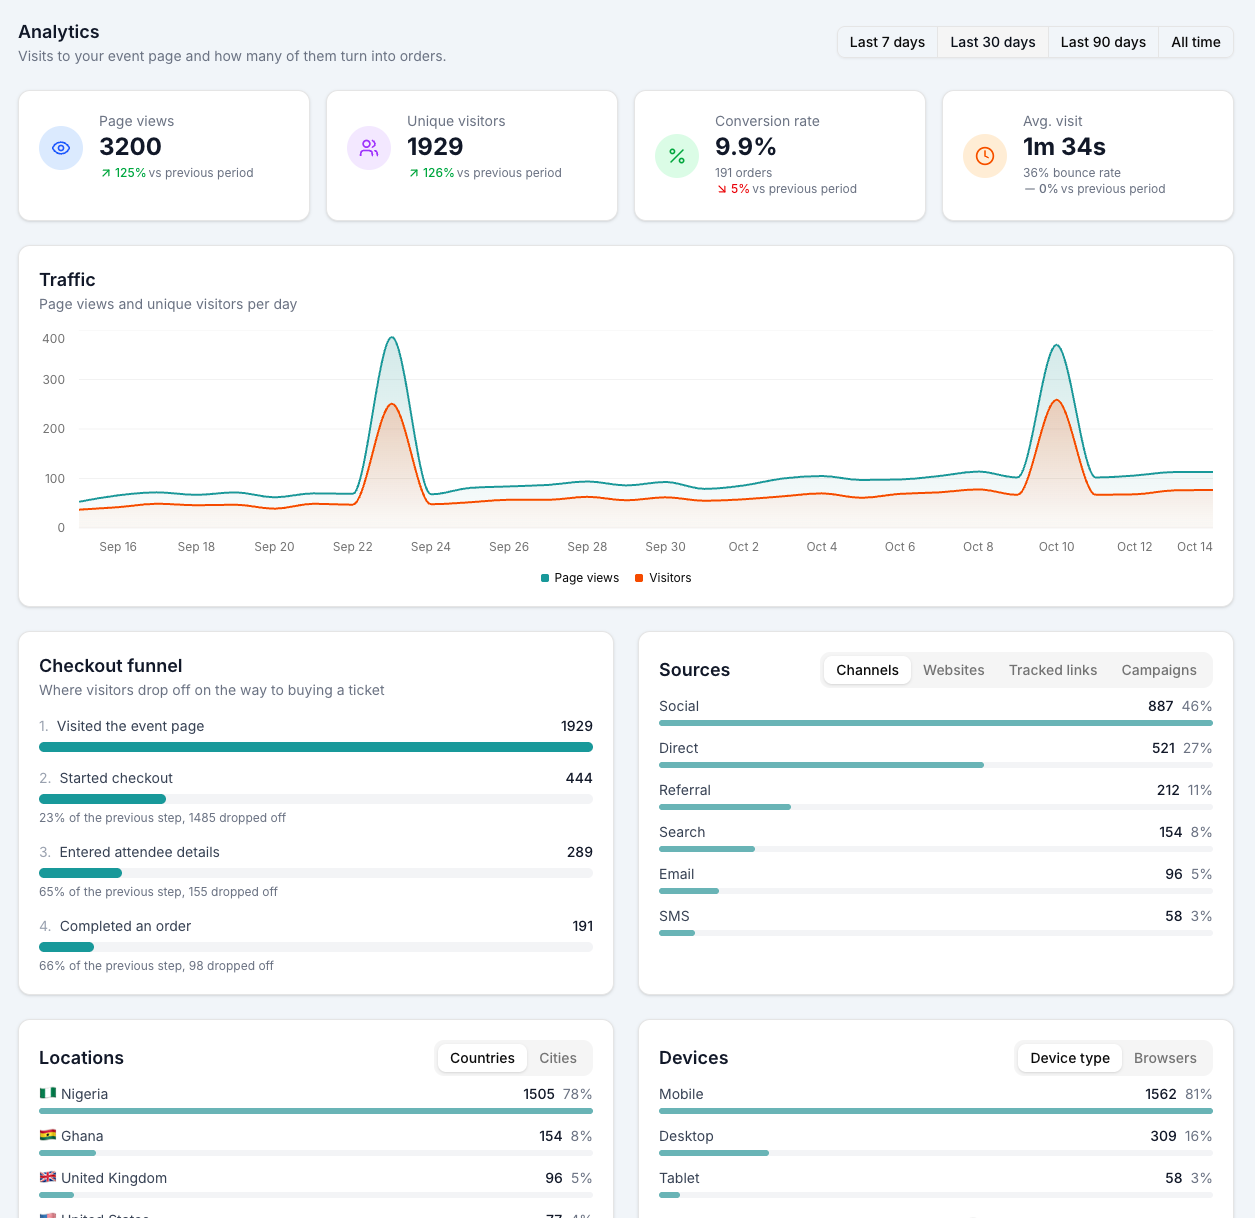
Open any event and click the new Analytics tab. Four numbers sit at the top:
- Page views: how many times your event page was opened.
- Unique visitors: how many different people opened it.
- Conversion rate: the share of visitors who went on to place an order.
- Average visit: how long people spend on the page, plus your bounce rate.
Pick a period (last 7, 30 or 90 days, or all time) and each number shows how it moved compared with the period before. If you posted about your event last week, you will see whether it actually brought more people in.
Below the numbers, a traffic chart plots views and visitors day by day, so a spike after an announcement or a quiet week is easy to spot.
Find out which platform sells your tickets
Most event links get shared on WhatsApp, Instagram and in group chats. Those apps usually hide where a visitor came from, so a lot of traffic shows up as "direct" and you are left guessing.
Tracked links fix that. Each one is your normal event link with a small tag on the end that says where it was shared. Analytics then counts the visitors from each tag separately.
- Share buttons tag links for you. When you share from your event's Share page using the WhatsApp, X, Facebook, LinkedIn or email buttons, the link is tagged automatically.
- A ready link for every platform. The Share page now lists a link for WhatsApp, Instagram, X, Facebook, TikTok, LinkedIn, email and SMS. Copy the one you need, paste it in your bio or post, and that platform gets its own line in your analytics.
- Name your campaigns. Type a campaign name such as "Early bird promo" and every link is tagged with it. You can then compare promotions against each other, not just platforms.
- Your QR code counts too. The event QR code is a tracked link, so scans from posters and flyers show up as their own source.
In Analytics, the Sources card shows all of this in one place: broad channels (social, search, direct, email), the websites that linked to you, your tracked links and your campaigns.
See where buyers drop off
Views are only half the story. The checkout funnel follows visitors through four steps:
- Visited the event page
- Started checkout
- Entered attendee details
- Completed an order
Each step shows how many people made it and how many dropped off from the step before. That tells you what to fix:
- Lots of visitors, few start checkout? The page itself may need work. Check your description, photos, date and ticket prices.
- Many start checkout but stop at attendee details? People may be put off by the price once fees show, or by how many tickets they have to fill in.
- Details entered but no order? Payment is the sticking point. A reminder post with the link, or a short deadline on early bird prices, can bring those people back.
Get to know your audience
The Locations card shows which countries and cities your visitors come from. For an in-person event, that helps you decide where to promote, or whether people are travelling in from another city.
The Devices card shows whether people browse on mobile or desktop, and which browser they use. That includes in-app browsers, so you can see how many people opened your link straight from Instagram or Facebook.
Private by design
We built analytics to respect your attendees as much as it helps you.
- No cookies, no ad trackers. Analytics runs on our own servers using privacy-focused software. Visitor data is never sold or shared with advertisers.
- Totals, not individuals. You see how many people came from Instagram or Lagos, never who they were.
- Your own visits are left out. When you open your own event page while logged in, it is not counted, so checking your page a dozen times a day won't inflate your numbers.
Get started
Analytics is live on every event, with nothing to switch on.
- Open your event from the dashboard and click the Analytics tab.
- Go to the Share tab and copy a tracked link for each place you promote your event.
- Optionally, add a campaign name for each promotion you run.
- Check back in a few days and see which links bring visitors, and which ones turn into ticket sales.
Numbers start counting from the moment visitors arrive, so the sooner you share your tracked links, the clearer the picture.